

See the ocean changing.
Explore a changing ocean through maps, photographs and science • from the Atlantic to the poles.
Ocean temperature · Currents · Waves · Wind · Salinity · Seabed · Marine life
See the ocean changing.
Explore a changing ocean through maps, photographs and science • from the Atlantic to the poles.
The atlantic briefing · fortnightly
Next briefing planned · Subject to review
Published 5 Nov 2026 · Observations: Apr 2004–Nov 2024 · Assessment: 20 Oct 2026
Atlantic circulation shows a weakening trend.
20+yearsOf Atlantic circulation measurementsApril 2004–November 2024
A large system of Atlantic currents carries warmer water north and colder water south. Measurements from 2004–2024 show a weakening trend in this circulation, known as AMOC. Scientists need longer observations to understand how much reflects natural variation or human influence. These measurements describe past conditions; they do not predict a date for a collapse.
ABOUT 30 KM ABOVE SEA LEVEL · 10 hPa
Outline: briefing patch. The selected reading is one grid cell; the briefing average covers the whole patch.
NOAA OISST v2.1 · native 0.25° grid · anomaly baseline 1971–2000
Map tools
Data status
Saved preferences
Save your layer, location and dates on this browser for up to 180 days. Turn off to clear them.
Privacy & cookiesSea areas & official forecasts
Choose a region to show its reference point on the map. Readings are for that point, not the whole area.
Official forecasts open on the Met Office or WMO website and are separate from our map readings. Reference lines are approximate; this map is for exploration, not navigation.
Blank or masked areas mean no data, not zero. Readings represent a grid cell; zoom adds no scientific detail.
Choose a region
Explore the Observatory
Follow the Atlantic to its polar connections.


Explore the seabed · Depth, relief & sediments
Explore the ridges, shelves and deep basins beneath the Atlantic. Open this section to load detailed maps.
Map services load when this section opens.
Tap the map for a source depth.
Drag to pan; pinch or use + and − to zoom. Tap for a reading. Keyboard: focus the map, use arrows to pan and +/− to zoom, then choose “Read map centre”.
Explore this location in OpenSeaMap ↗
Depth colour key
Source colour key for the detailed EMODnet layer. Relief shading changes brightness. The wider global background has its own terrain styling.
Sediment colour key · BGS
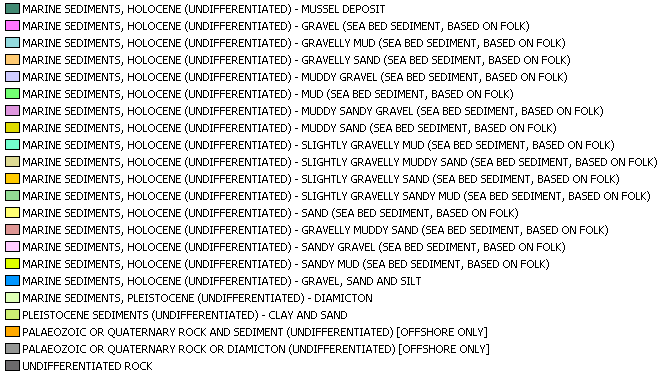
Original BGS classifications and colours. Sediment type alone does not identify which species live here.
Sources, coverage & accuracy
EMODnet DTM 2024 provides detailed regional bathymetry at approximately 115 m grid spacing. Some areas use GEBCO estimates; grid spacing is not survey accuracy. The global relief background uses an older EMODnet / GEBCO compilation. Zooming loads additional imagery, up to the source detail available.
Depth readings come from the EMODnet mean-depth service, not our former 0.1° sampled grid. They are rounded to a metre for display; this does not imply metre accuracy. EMODnet depths are referenced to Lowest Astronomical Tide where available; source references vary, including in GEBCO-filled areas. These are compiled reference maps, not live soundings or navigation charts.
BGS sediment mapping covers the UK Continental Shelf at 1:250,000 scale. Blank areas are unclassified in this layer. Map services and point readings require an internet connection; an unavailable service is reported separately from missing coverage.
EMODnet tile edition: 2024. Service configuration checked 16 September 2026. Survey dates vary. Contains British Geological Survey materials © UKRI 2026.
EMODnet depth sources ↗ · BGS offshore viewer ↗ · BGS data & licence ↗
UNDERSTANDING THE AMOC
A circulation that shapes climate.
The Atlantic Meridional Overturning Circulation (AMOC) carries warm water northwards in the upper ocean and colder water southwards at depth. It redistributes heat, influencing regional temperatures, rainfall and sea level. Met Office ↗
A longer record. A clearer view.
RAPID’s October 2026 release extends the observed record through November 2024. It updates earlier calculations as well as adding months. The chart below uses this complete revised release.
—
What is changing?
In its 20 October 2026 update, NOC reports a weakening trend of −0.7 ± 0.6 Sv per decade over roughly 20 years. That long-term estimate is separate from the selected month’s transport. Read NOC’s assessment ↗
Why does it matter?
Overturning carries heat through the Atlantic and influences regional temperatures, rainfall and sea level. A transport reading alone does not measure a local impact on weather, wildlife or fisheries. How RAPID measures it ↗
What remains uncertain?
The record varies strongly from month to month. NOC says longer monitoring is needed to separate natural variability from human influence. This record does not provide a date for an AMOC collapse.
See the RAPID section on the Currents map ↑ · Release v2024-2 ↗

Simplified circulation pathways — explanatory illustration, not live data. Global circulation context; not every pathway shown is part of the AMOC.
Red arrows show warm surface flow; dashed navy arrows show cold deep flow. Arrows show direction, not speed or volume. Open full-size diagram Swipe across the diagram to explore.
Adapted from ESA · Credits & licence
How the circulation works
Surface movement. Deeper connections.
Winds and Earth’s rotation shape large surface currents and ocean gyres. Cooling and salinity changes can make water dense enough to sink; winds and mixing also help sustain the ocean’s overturning circulation.
This simplified “conveyor belt” shows connections between ocean basins. Real currents branch, swirl and change. It does not show every current, its present strength or a journey along one continuous route.
AMOC means Atlantic Meridional Overturning Circulation: the Atlantic part of this wider system, involving both upper and deep water. Our currents map shows modelled surface flow; it does not measure AMOC strength.
See transport with depth · November 2024
At each depth, this line totals the northward transport above it across the RAPID section. Its maximum gives the depth-coordinate overturning estimate. The decline below that maximum reflects the returning deep flow. The horizontal axis is transport in Sv, rather than local speed.
Published monthly depth-coordinate streamfunction · release v2024-2. This section has its own historical month; the surface-current map has a separate forecast date. Source and method ↗
What the observations show
AMOC transport at 26.5°N · RAPID
Historical published record — not a live reading.
Estimated overturning transport at 26.5°N. The thin line is the published record; the bold line is a trailing 12-month mean. 1 Sv is one million cubic metres per second. Uncertainty is not plotted.
Short-term variability alone does not establish a collapse or a long-term trend.
The Atlantic over time
Explore temperature, stored ocean heat and coastal sea level alongside atmospheric patterns and the published circulation record. Each chart has its own dates, area and sources.
Loading historical records…
Atmospheric contextNorth Atlantic Oscillation
A pressure pattern that helps shape weather across the North Atlantic. The bars show its daily index, not a local weather forecast.
Daily index · orange: positive · blue: negative
Inspect a specific day
Keep the Atlantic visible
Your support helps keep the Observatory accessible to everyone and improves its maps, explanations and resources.
Support the ObservatoryOne-off support · Choose your amount · Opens Stripe’s payment page